Am I Addicted? Visualizing My Internet Browsing Habits
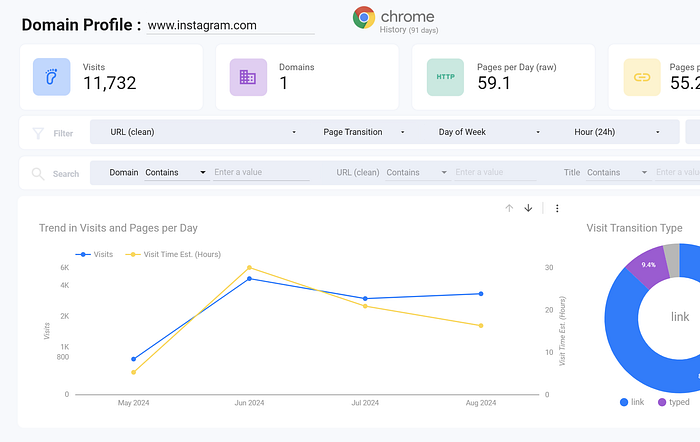
In 3 months, I averaged 0.8 hours per day, totaling 73 hours or about 3 full days on Instagram.

Sometimes, it’s easy to lose track of time online. One minute, I’m checking a notification, and the next, I’ve gone through dozens of YouTube videos or Instagram posts. One day, I started to wonder: how much time am I really spending on these sites? And that’s when I decided to dig into my browsing data. Here’s what I did — and how you can try it too if you’re curious about your own online patterns.
See a live demo of my browsing habits here.
Step 1: Export Your Chrome Browsing History
The first step was to gather the data. I created a simple browser extensions, the Chrome History Analysis to CSV extension (works both on Chrome and Edge). With one click, I was able to export my browsing history into a CSV file — a sort of digital diary of where I’d been.
You can learn more about it and download here.

Step 2: Import Data into Google Sheets
Once I had the file, I uploaded it into Google Sheets. Seeing everything laid out was a little surreal: hundreds of links and timestamps, showing me exactly where my time was going. Sheets made it easy to organize and sort through, preparing it all for the next step.
You can easily create a new Google Sheet by typing sheet.new into your browser

Step 3: Visualize with Looker Studio
I wanted to see patterns, not just a list of links. So, I created this Chrome Browsing History Analysis template in Looker Studio, which transformed my data into visuals that brought my online habits to life. Suddenly, I could see clear trends — what sites I visited the most, an estimation of how long I stayed on each, and even how often I revisited them.
Seeing my patterns on a graph was like looking at a map of my own habits. I could see that Instagram, for instance, took up a surprising amount of my time in small chunks that added up over days !
Over the past 3 months, I averaged 0.8 hours per day, totaling 72 hours or 3 full days
Feel free to check the template here.

Reflections on My Digital Routine
This process was more than just interesting — it made me rethink my online habits. Seeing a clear, visual breakdown of where my time went showed me just how often I returned to certain sites out of habit.
I wouldn’t say I’ll stop visiting Instagram, but this feels like the first step toward being more intentional with my time.
For anyone curious about their own habits, this simple approach offers some truly eye-opening results.